Bayesian analysis with Python - simple
Here is an illustration on a Hierarchical Poisson failure rates from Clark and Gelfand, using Python and the PyMC package.
The Python code is as simple as the R code, although it is obviously more object-oriented. The main part are highlighted below. These are in fact where we specify the prior distributions:
alpha0 = Exponential('alpha0', 1.0, value=1.)
beta0 = Gamma('beta0', alpha=0.1, beta=1.0, value=1.)
theta = Gamma('theta', alpha=alpha0, beta=beta0, value=ones(k))
Running the model:
var_list = [alpha0, beta0, theta, y]
M = MCMC(var_list)
M.use_step_method(AdaptiveMetropolis, [alpha0, beta0])
M.isample(100000,burn=20000,thin=1,verbose=2)
Matplot.plot(M)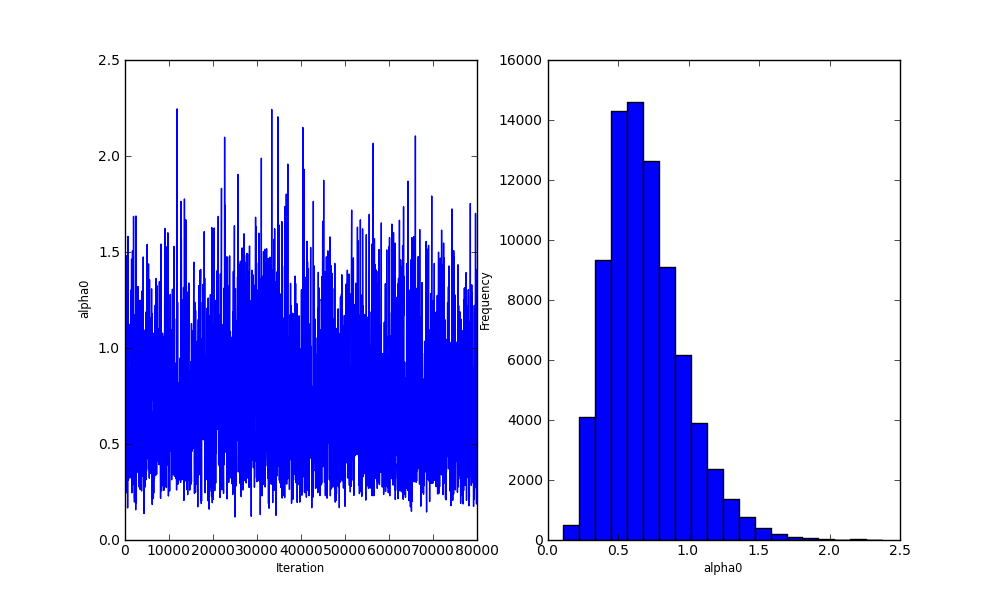
- Plot one
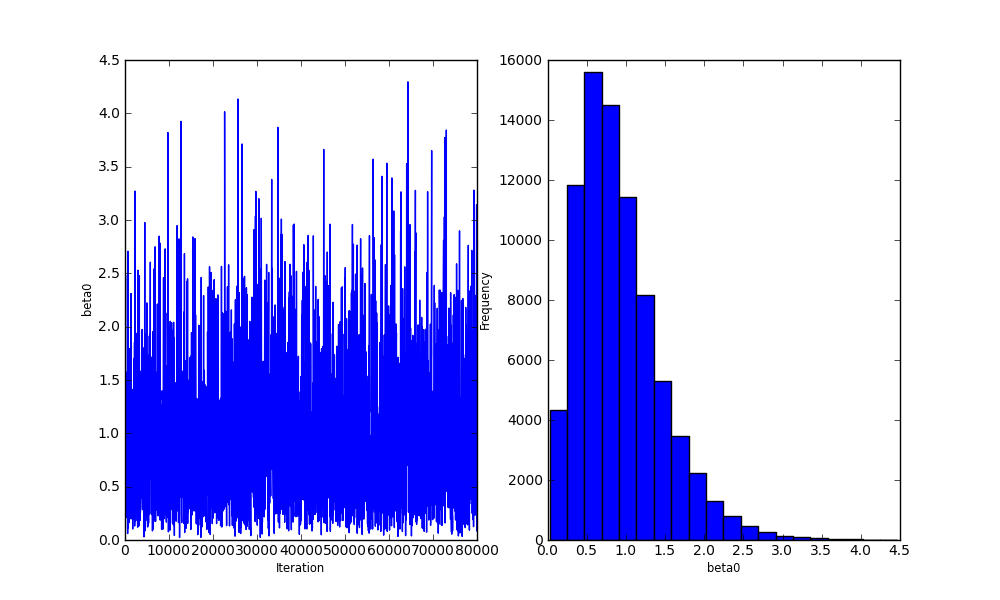
- Plot two
Reference:
- PyMC3
- Clark, J.S. and Gelfand, A. (2006). Hierarchical modelling for the environmental sciences: statistical methods. Oxford university Press
My site is free of ads and trackers. Was this post helpful to you? Why not