Plot function in R par 1
Below are a few examples of using plot() function in R:
set.seed(1919)
x <- rnorm(1000)
y <- x + rnorm(1000)
plot(x, y)
Example 1: Basic Scatterplot in R
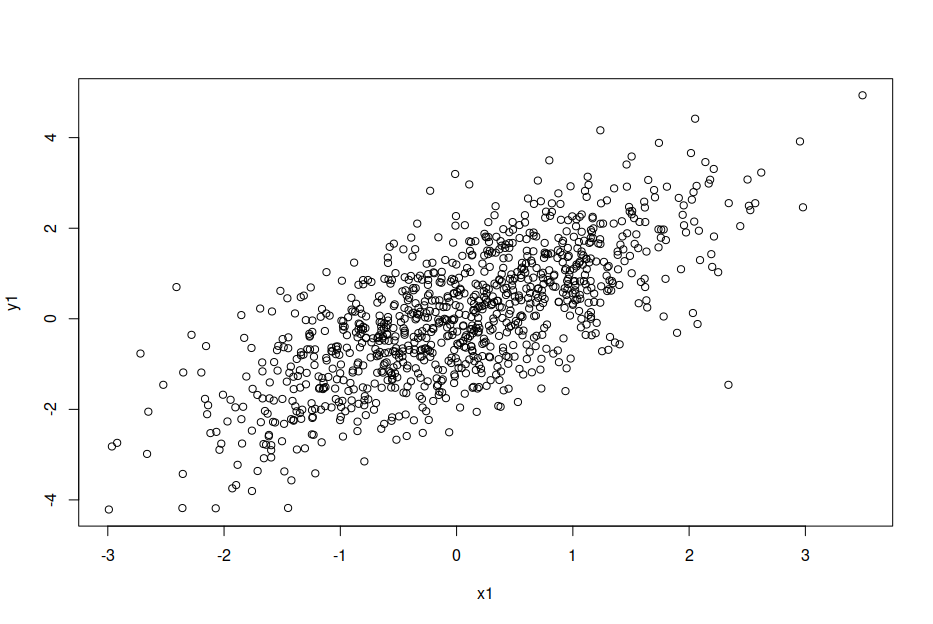
- A Scatterplot with Default Specifications in Base R
Example 2: Scatterplot with User-Defined Title & Labels
plot(x, y,
     main = "Scatterplot",
     xlab = "X-Values",
     ylab = "Y-Values")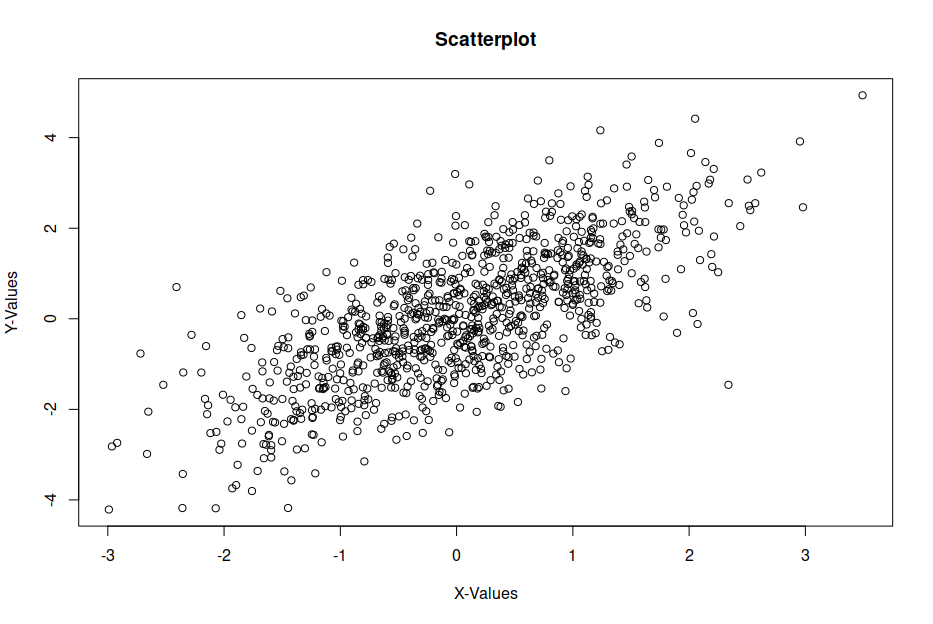
- Scatterplot with User-Defined Main Title & Axis Label
Example 3: Regression
plot(x1, y1)
abline(lm(y1 ~ x1), col = "red")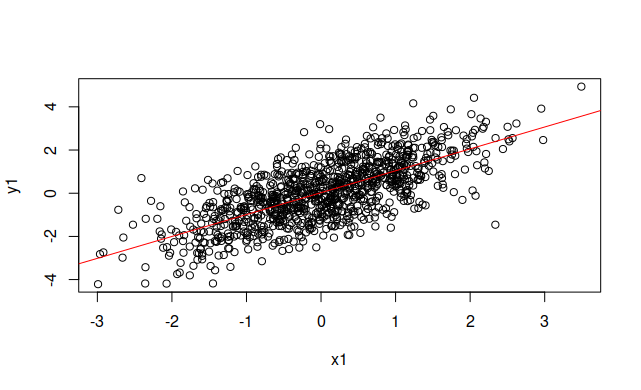
- Regression line in R
Example 4: Density Plot in R
plot(density(x1)) 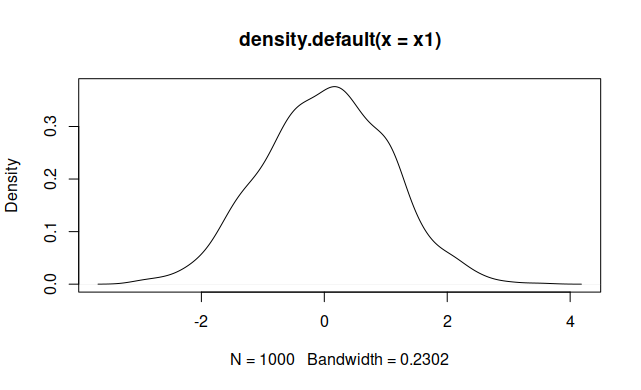
- Density plot in R
Example 5: Plot with Colors & PCH According to Group
group <- rbinom(1000, 1, 0.3) + 1
plot(x1, y1,
     main = "Plot",
     xlab = "X-Values",
     ylab = "Y-Values",
     col = group,
     pch = group)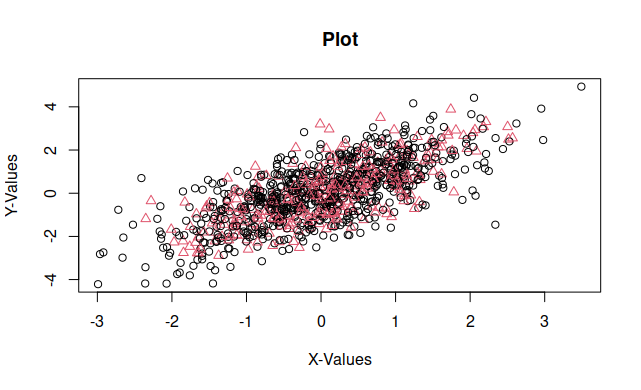
- Adding Grouping Variable.
Example 6: Plot Multiple Densities in Same Plot
plot(density(x1))
lines(density(y1), col = "red")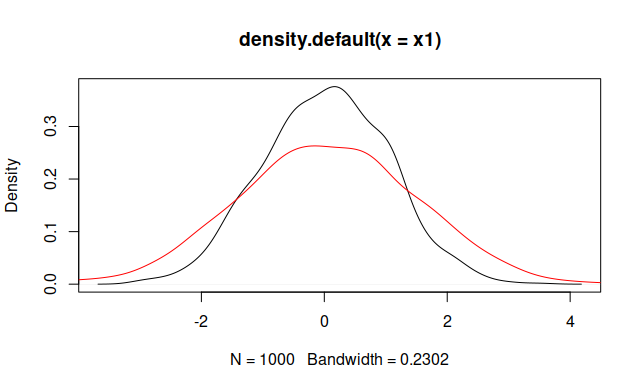
- Plot Multiple Densities in Same Plot
Example 7: plot() and legend()
head(pressure)
temperature pressure
1           0   0.0002
2          20   0.0012
3          40   0.0060
4          60   0.0300
5          80   0.0900
6         100   0.2700
plot(pressure)
plot(pressure, col="red", pch=19)
points(pressure$temperature/2, pressure$pressure,col="blue", pch=17)
legend("topleft", c("line 1","line 2"), pch=c(19,17), col=c("red","blue"))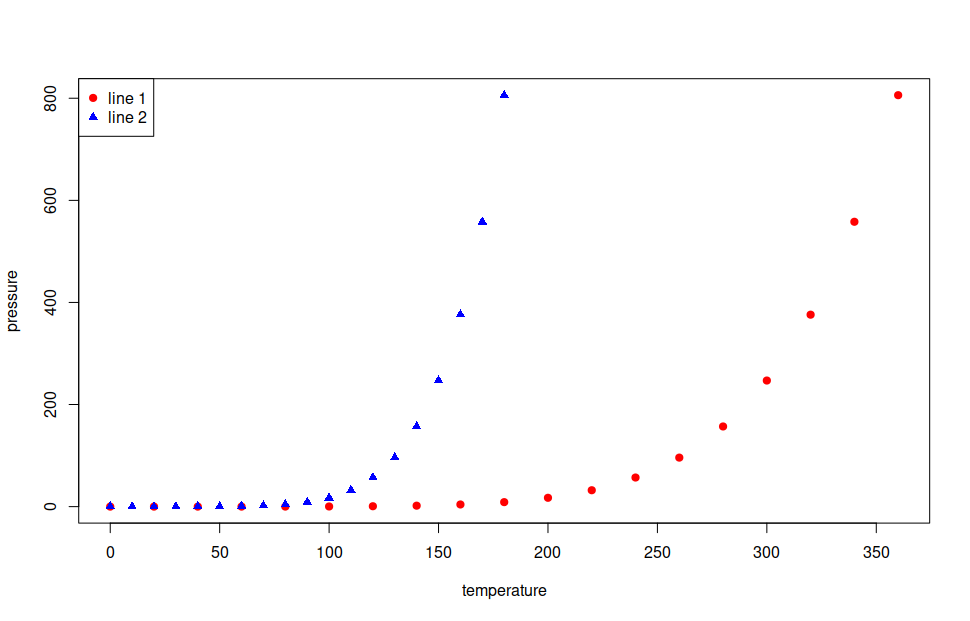
- plot() and legend()
Example 8: Label data points
plot(pressure)
abline(h= 247, v=300, col="red", lty=2)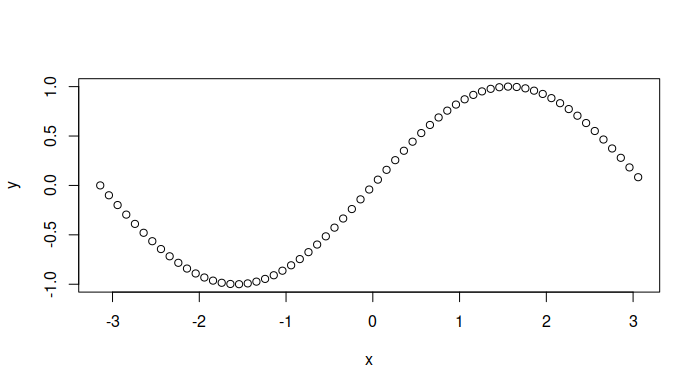
- Sine plot
Example 9: Singe plot
x = seq(-pi,pi,0.1)
y = sin(x)
plot(x,y)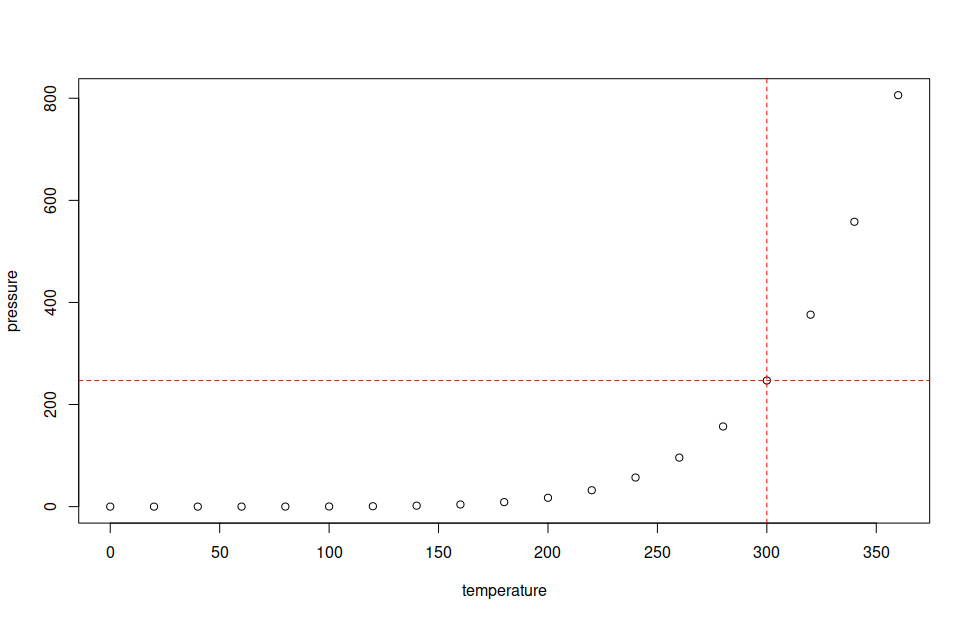
- Label data points
Example 10: Matrix of Scatterplots
set.seed(42424)
x <- rnorm(500)
y <- x + rnorm(500)
z <- runif(500)
data <- data.frame(x, y, z)
pairs(data)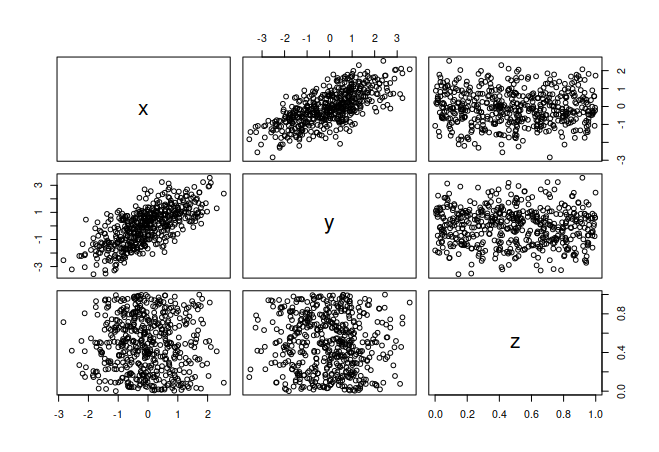
- Matrix of Scatterplots
My site is free of ads and trackers. Was this post helpful to you? Why not