Plot function in R part 2
First six observations of the data set:
head(iris)
  Sepal.Length Sepal.Width Petal.Length Petal.Width Species
1          5.1         3.5          1.4         0.2  setosa
2          4.9         3.0          1.4         0.2  setosa
3          4.7         3.2          1.3         0.2  setosa
4          4.6         3.1          1.5         0.2  setosa
5          5.0         3.6          1.4         0.2  setosa
6          5.4         3.9          1.7         0.4  setosa
Example 1: Change the shape of the points and scale them down by 0.6
plot(Petal.Width ~ Petal.Length, data=iris,
     pch=16,
     col="dodgerblue1")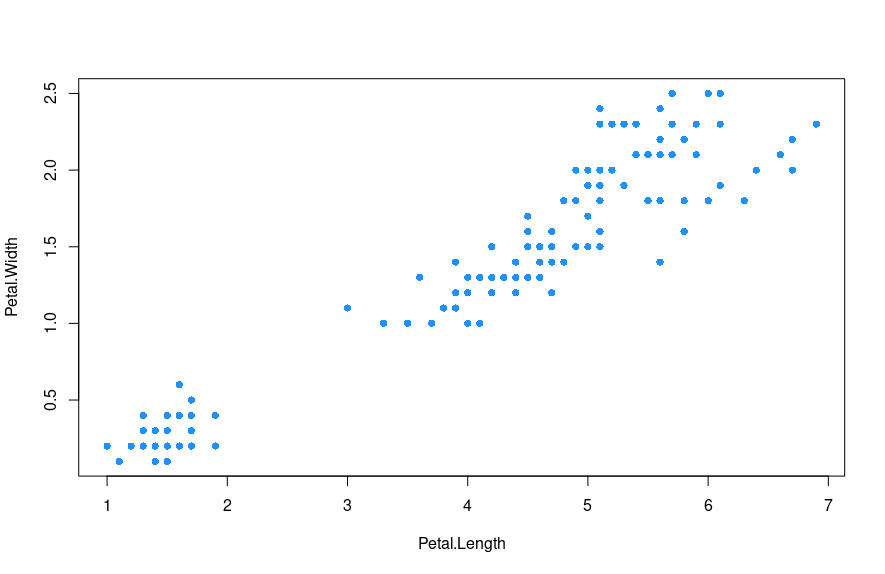
- Iris Flower Data Set
Example 2: Scatterplot Matrix
plot(iris,
     col=rgb(0,0,1,.15),
     pch=19)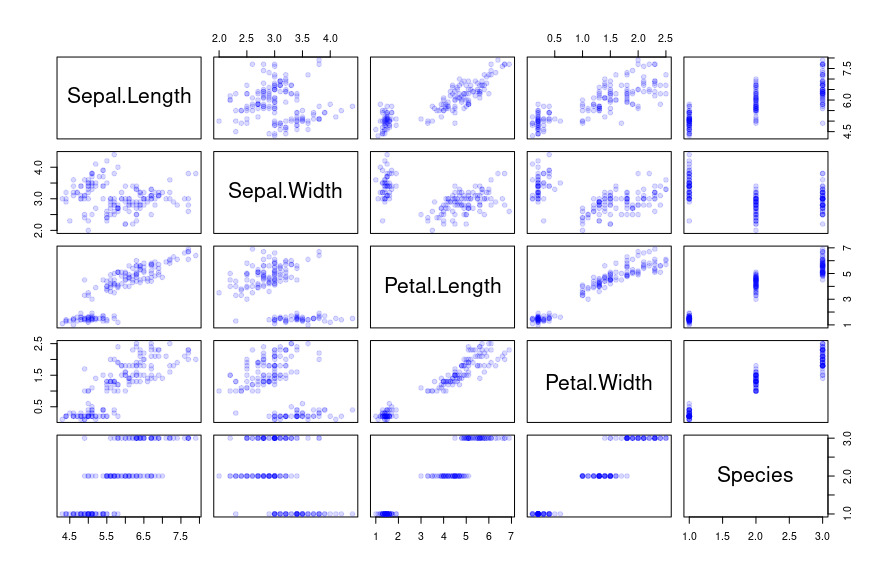
- Iris Flower Data Set
Example 3: Coplots (conditioning scatter plots)
coplot(Petal.Length ~ Petal.Width | Species,
       data=iris,
       columns=3,
       bar.bg=c(fac="lightskyblue"),
       col="dodgerblue1")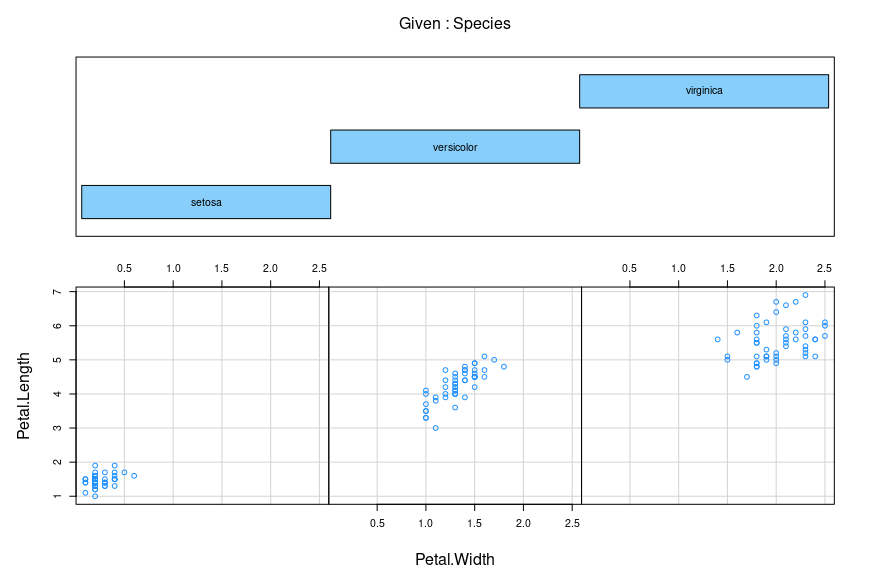
- Iris Flower Data Set
Example 4: 3D scatter plots
scatterplot3d(Sepal.Length, Sepal.Width, Petal.Length,
              pch = 16,
              type="h",
              angle = 45,
              xlab = "Sepal length",
              ylab = "Sepal width",
              zlab = "Petal length",
              color = c("brown1","dodgerblue1","limegreen")[as.integer(Species)])

legend("top",
       pch = 16,
       cex = 0.8,
       horiz = TRUE,
       legend = levels(iris$Species),
       col =  c("brown1","dodgerblue1","limegreen"))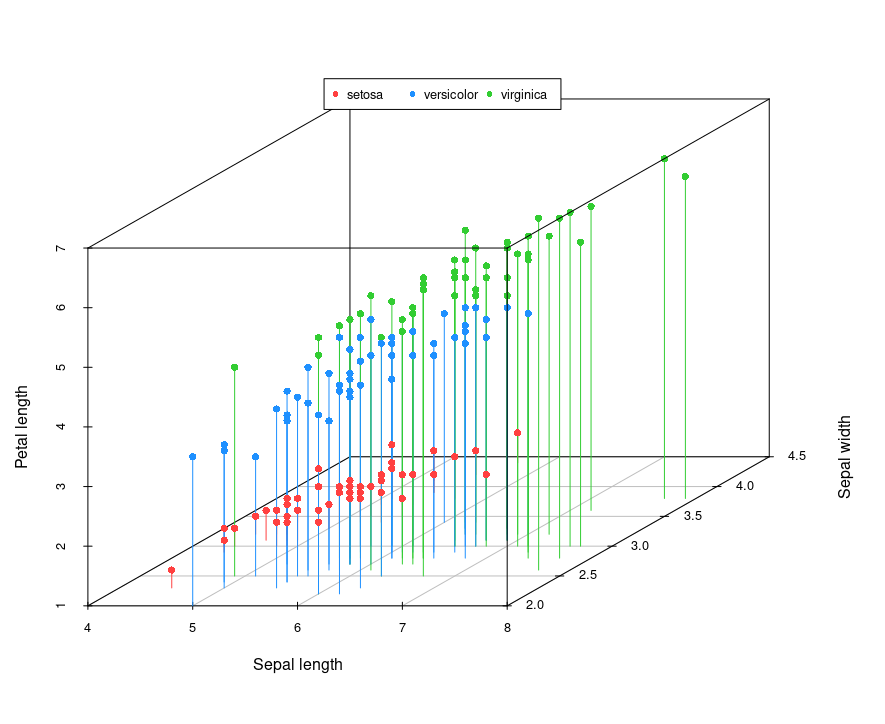
- Iris Flower Data Set
Example 5: Plot Multiple Histograms
h1 <- rnorm(1000,6)
h2 <- rnorm(1000,4)


hist(h1,
     col=rgb(1,0,0,0.5))
hist(h2,
     col=rgb(0,0,1,0.5),
     add=TRUE)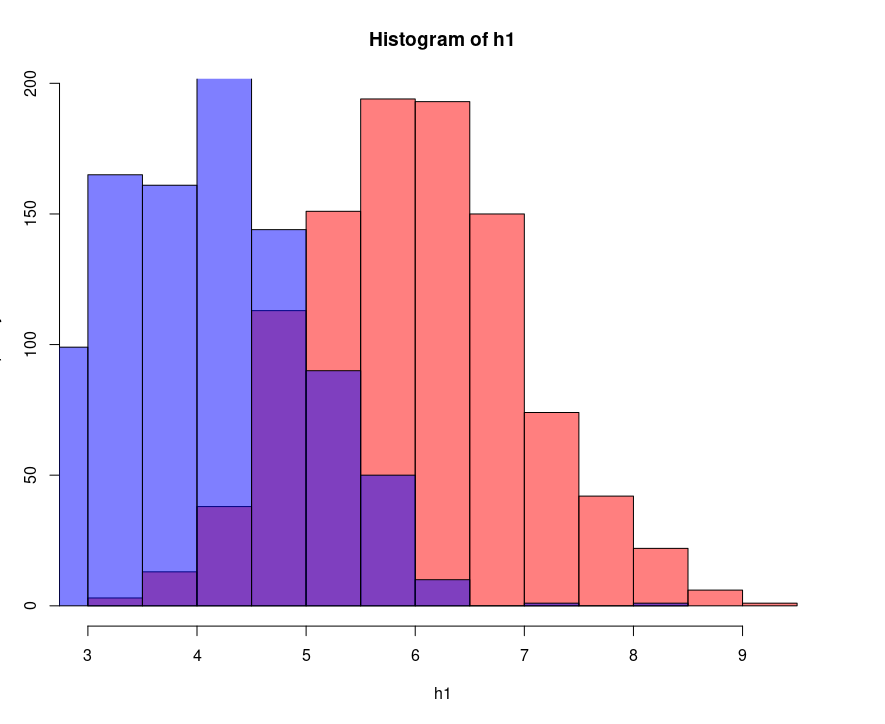
- Multiple Histograms example
Example 6: Using ggplot2
library("ggplot2")
ggplot(iris, aes(x=Petal.Length, y=Petal.Width, colour=Species, size=Sepal.Width)) +
  geom_point(alpha=0.3)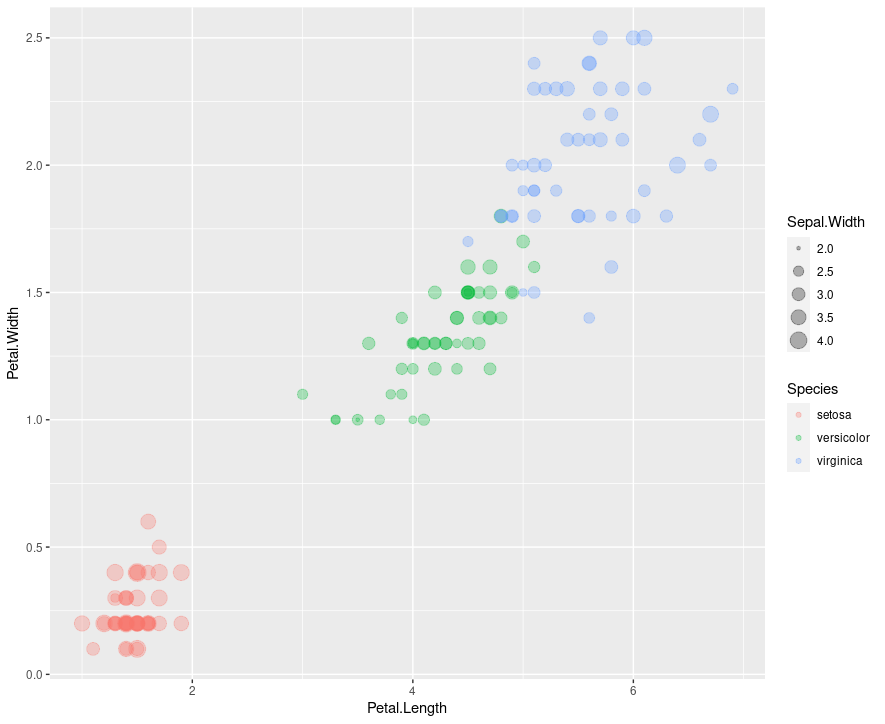
- Using ggplot2 example
My site is free of ads and trackers. Was this post helpful to you? Why not